Why do we need economic growth within industry to lower our taxes? Why can’t we just cut our budget?
Lets start by looking at the current reality.
Cutting our budget will be a critical step in finding fiscal solvency for the city. Current initiatives are vastly overreaching for a community that is on the brink of financial collapse. However, the fiscal mismanagement that has occurred over the past several years makes cutting the budget to the degree required for individual homeowners to see the results nearly impossible. To better understand this, we have to look at the current strategy that the city has employed for growth to meet the expectations of the metro council.
Our current city tax levy in about $10 million dollars. Additionally, the city of Belle Plaine is roughly $20 million is debt. For various reasons over the past several years, the city of Belle Plaine has spent a wild amount of money that it couldn’t afford in an attempt to increase housing capacity. We have incurred much of this debt in an attempt to raise our population density to meet their expectations. A portion equal to more than 10% of the $10 million annual tax levy just goes to pay against that debt. The plans that the city has push forward, will add to both the debt as well as the annual tax levy. Unless the city staff begin to restrain their efforts to a reasonable degree, at some point our annual budget will expand if only to pay off the debt it has incurred.
Currently, (according to Scott County), the total market value of Belle Plaine (within the city limits), is about $930 thousand(1). Approximately 70% of this total market value is residential property. The tax on residential property is baselined at 1%, but the actual taxes rate is figured as a percentage of that baseline. Business property is taxed at a baseline of 1.5 for the first $150 thousand, and 2.0% for any value that exceeds $150 thousand. Due to the complexity within the data, I’m going to try and keep this as simple as possible.
Assuming that about 70% of our total market value is residential, then the total market value of the residential portion will be about $735 million. At a 1% baseline, this makes our residential net capacity about $7.35 million. This is where I’m going to keep things as simple as possible because there are around 165 individual business properties in Belle Plaine, and 90% are valued over $150 thousand. According to Scott County, the total market value of the business portion is only $115 million. The resulting tax capacity is about $2.25 million. There are some other taxable categories that are nominal to this total; these include rental apartments which are taxed at 1%-1.25% and may add about $550 thousand in potential taxes. Additional agricultural concerns may add as much as $165 thousand in potential taxes. These are nominal to the bottom line, so let’s focus on just the residential and industrial aspects.
Lets look at how this plays out. Right now, The break down of our taxes is heavily favored toward residential property. Note Figure 1.
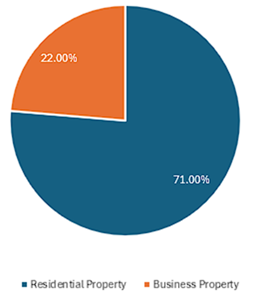
Figure 1. Current tax base (Belle Plaine, MN)
What is important to understand is that the current city’s proposals focus on growing our tax base through an increase in residential properties taxes. The idea is, more residents, more taxable population. The problem with this strategy is that the investment in additional property development will require decades to pay off, while the return on that equity will only be seen if developers actually build on it, then people buy those properties and pay the taxes on it. As our property taxes grow in comparison to neighboring cities such as Le Sueur and New Prague, this strategy begins to look more like speculation than investment.
Comparing the breakdown of our total market value with other cities such as Le Sueur gives us a better understanding as to why their taxes are lower than ours. Le Sueur depends on its residential property far less than we do, because it has a considerably larger business property segment to leverage. Only 58% of their tax base comes from residential property compared to our 71%. This is important because the inverse is also true; they can draw on a business and industrial base that is 31% of their communities value opposed to our 22% and as pointed out earlier, that base is taxed at 1.5%-2% rather than only one percent. Note Figure 2.
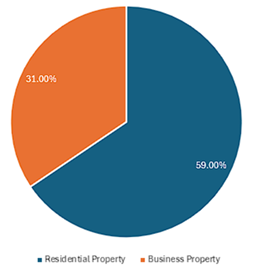
Figure 2. Current tax base (Le Sueur, MN)
To illustrate this point further, I will use Coborn’s Foods as an example. Whether you love Coborn’s or hate the change that it represents, let break down the numbers. When Coborn’s was proposed over a decade ago, the community investment to bring them to town was about $600 thousand for small scale street improvements in the area. Most of that was paid for with grants to from the state. Additionally, for ten years a portion of Coborn’s taxes were earmarked to pay for the city infrastructure upgrades required for the construction of their facility. This is called a TIF (Tax Increment Financing). Another portion was an abatement (forgiveness) to offset the cost of investing in the Belle Plaine economy. The TIF and abatement expired in 2025 and Coborn’s foods was assessed to be valued at $5.6 million. Their contribution to our tax levy was more than $112 thousand. To put this in perspective, a $300 home paid between $1400 to the city (this does not include the county or school district’s portions of the tax). This means that you would need an additional 80 homes valued at $300 thousand to gain the same tax revenue as one Coborn’s foods.
There are many opinion out there that we should just cut everything nonessential and return to the days when we were a small agricultural and bedroom community. That ship sailed a couple decades ago. We are unfortunately entrenched in the Metro Council’s purview. Even if we could get out of the Metro Council jurisdiction (but that should always be our goal) our current debt has tied us to a ‘grow or die’ paradigm.
(1)Figures are rough estimates and change from year to year